Analysis of Longitudinal and Clustered Data

Published

December 26, 2025

Introduction

Clustered and longitudinal analysis

Individual level RCT: randomize individuals to control group and treatment group and measure the outcome for both groups. Vast majority of data analysis of RCTs and observational data uses some from of regression (linear, logistic, generalized linear models, …)

Simplest case is linear regression with single covariate, and using ordinary least squares (OLS) regression method:

\[ Y_i = \beta_{0} + \beta_{1}X_i+e_i \]

where \(e_i\) is random error with variance \(\sigma^2\). This method assumes that errors \(e_i\) are independent of (uncorrelated with) each other:

\[ Cov(e_i,e_j) = 0 \ when \ i \neq j \]

However, clustered and longitudinal data often be expected to be correlation with group (cluster):

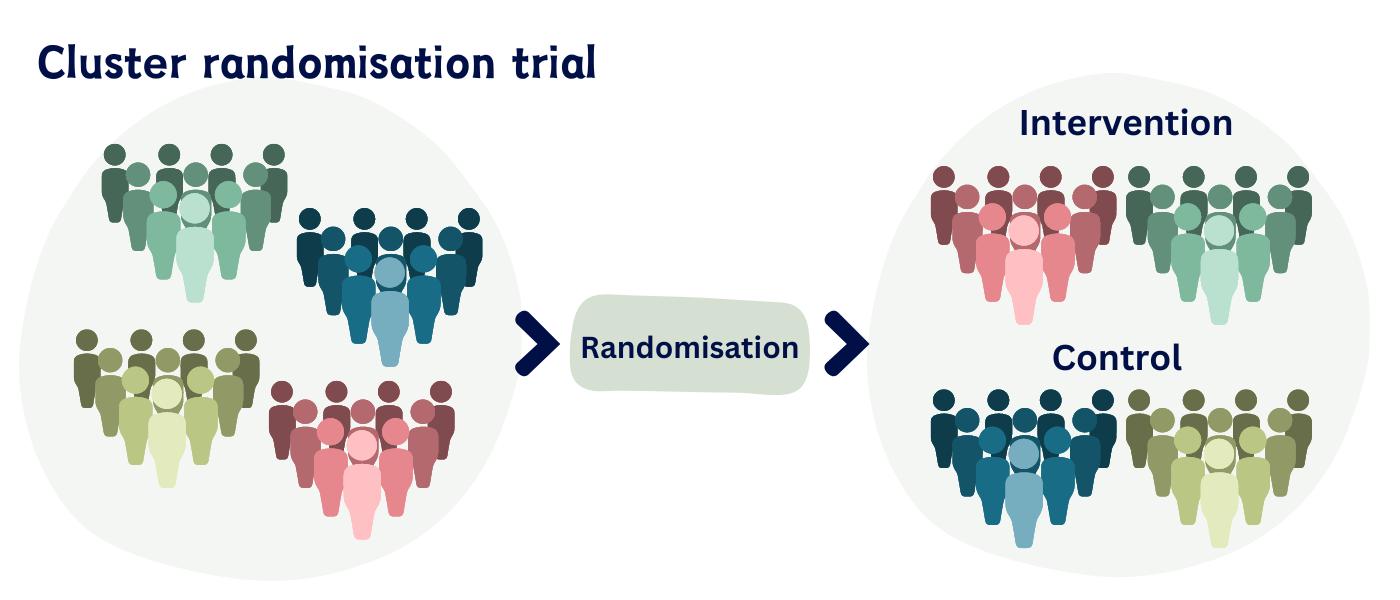
  • individuals may belong to clusters such as families, schools, medical centers. (clustered)

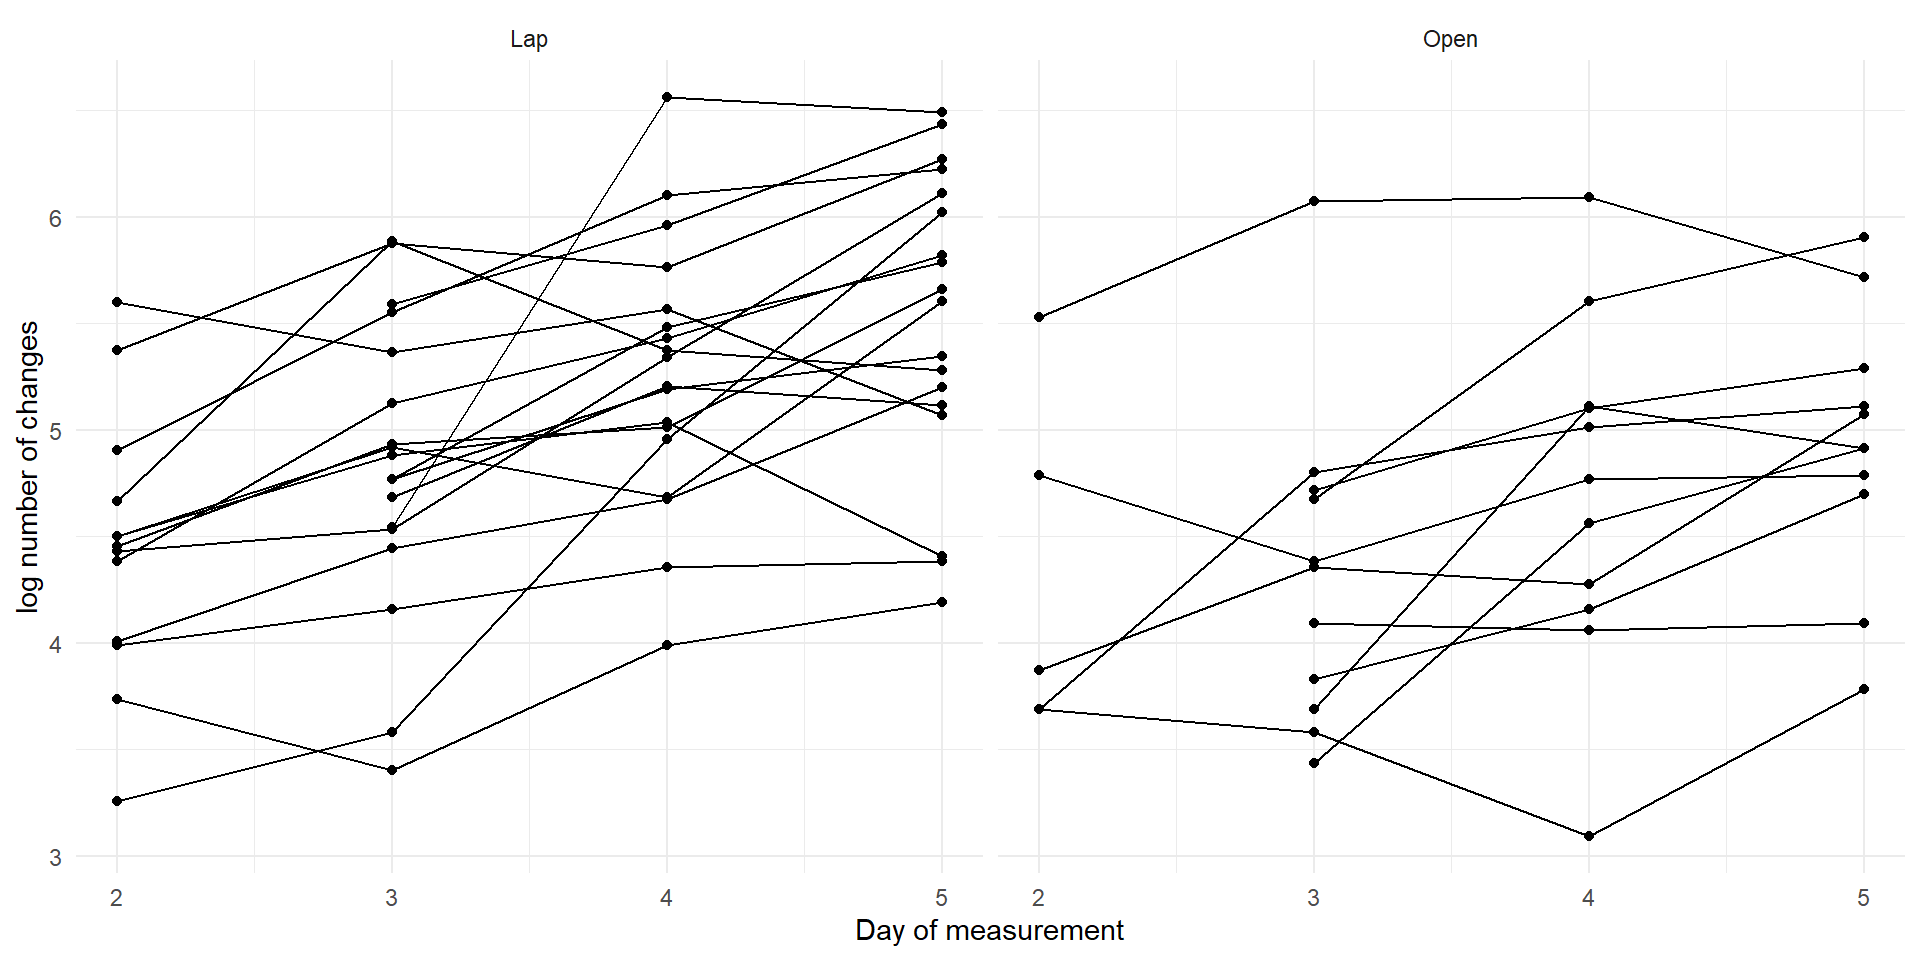
  • the ‘units’ are not individuals but are repeated measures of the same variable on an individual over time. (longitudinal)

=> It is not make sense to assume the errors in the regression model are all uncorrelated with each other

=> If using OLS regression methods (ignoring the correlation structure) to those type of data will generally product unbiased estimates of effect but:

  • Incorrect standard error (SE) => poor inference (more important)

  • The estimates of effects (i.e. regression coefficients) may be more variable (less efficient) than they could be

Example study design with correlated data

Cross-over trial

Pros:

  • Within-individual comparison - variability of outcome for treatment effect reduced because less variability within- than between-individuals

  • Fewer participants needed than a parallel group design

Cons:

Carry over effect of the intervention (design assumes minimal carry over effect)

Participants drop out after 1st treatment and don’t receive 2nd treatment

Generally, only suitable for:

  • Participants with conditions or diseases that are chronic or relatively stable
  • Short-term outcomes
  • Interventions with short term impact, so washout period is feasible

Longitudinal data

In this practical we will use data from a study investigating recovery following appendectomy in children. The aim of the study was to determine whether the children who underwent a laparoscopic appendectomy achieved a faster rate of recovery than children who underwent conventional “open” appendectomy.

In this study a measure of recovery was made using an “uptimer”, a device worn by the children on their thigh. The uptimer senses the position of the thigh and records the times of changes from a horizontal position to a “vertical” position (at least 45 degrees from the horizontal). An increasing number of position changes (horizontal to vertical) from one day to the next is a marker of recovery.

Data were obtained from 29 children aged between 8 and 15 years, 18 of whom underwent laparoscopic appendectomy and 11 underwent open appendectomy. The children were not randomly assigned to the types of operation – the decision was made by the surgeon on call at the time of presentation. The uptime data was intended to be recorded for each child from day two post-operatively and thereafter, however some missing data resulted. In this practical we consider days two to five post-surgery.

library(haven)
library(ggplot2)
appendix <- read_dta("./data/appendix.dta")

appendix$lognchanges = log(appendix$nchanges)
appendix$group <- factor(appendix$group,labels = c("Lap","Open"))
ggplot(appendix, aes(day,lognchanges,group=patid))+
  geom_point()+
  geom_line()+
  facet_wrap(~group)+
  theme_minimal()+
  labs(y = "log number of changes")

Clustered Randomised trials

Cluster randomised trials are experiments in which clusters of individuals (e.g. schools, villages, general practices) rather than independent individuals are randomly allocated to intervention groups

Potential reasons include:

  • Intervention naturally applied at the cluster level (e.g. Effect of water and environment revitalisation in informal settlements in Indonesia and Fiji (RISE))

  • To avoid treatment group contamination (e.g. education program vs usual care to patients in a general practice)

  • Applying the intervention at the cluster level is more feasible than at the individual level (e.g. intervention at a school)

  • Ethical considerations

  • To enhance participant compliance

Unit of randomisation: cluster

Unit of outcome measure: individual

  • Observations on participants in the same cluster tend to be correlated (intracluster correlation)

  • Sample size for a cluster randomized trial needs to be greater than an individually randomized trial

  • Sample size needs to be inflated by ‘design effect’ which depends on intracluster correlation and average cluster size. (Note, it is better to have a large number of clusters with less participants per cluster, than a small number of clusters with many participants per cluster)

Note

The analysis of outcome measures at the individual participant level need to take account of clustering

How to choose method of analysis

Based on:

  • Data structure

  • Research question

Comparing within cluster

When analysis question involves comparisons within clusters, considering the clustering increases precision of estimation (lower standard errors, smaller P-values). Because we are removing a source of variation from the comparison

Data structure examples:

  • Longitudinal studies (collect the same measurement overtime, and compare within individuals)

  • Cross over-trials

Comparing between clusters

When analysis question involves comparisons between clusters, considering the clustering decreases precision of estimation (higher standard errors, higher P-values). Because positive intra-cluster correlation reduces the amount of independent information provided by individuals

Data structure examples:

  • Cluster trials

Summary

Study designs have the correlated observations:

  • Clusters – individuals from the same family, hospital, school

  • Longitudinal data – repeated measures of an outcome on the same individual

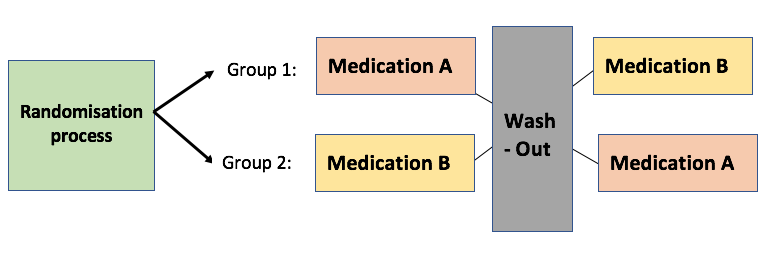
  • Paired data – two measurements from the same individual (e.g. cross-over trials)

=> If we ignore this correlation, conclusions obtained will be misleading: Incorrect standard errors (will be illustrated in the next section Comparison within cluster)

Accounting for clustering:

  • Increases precision for within-cluster comparisons

  • Decreases precision for between-cluster comparisons