We want to fit a multivariate linear regression with Sepal.Length as the outcome variable and Sepal.Width and Species as predictors. What is the difference between Sepal.Length ~ Sepal.Width + Species and Sepal.Length ~ Sepal.Width * Species?
The second formula includes an interaction term. When we use an interaction term, we assume that the effect of sepal width differs across species; that is, the slope of sepal width is different for each species. When we use the first formula, we assume that the effect of sepal width is the same across all species.
R code to ilustrate this
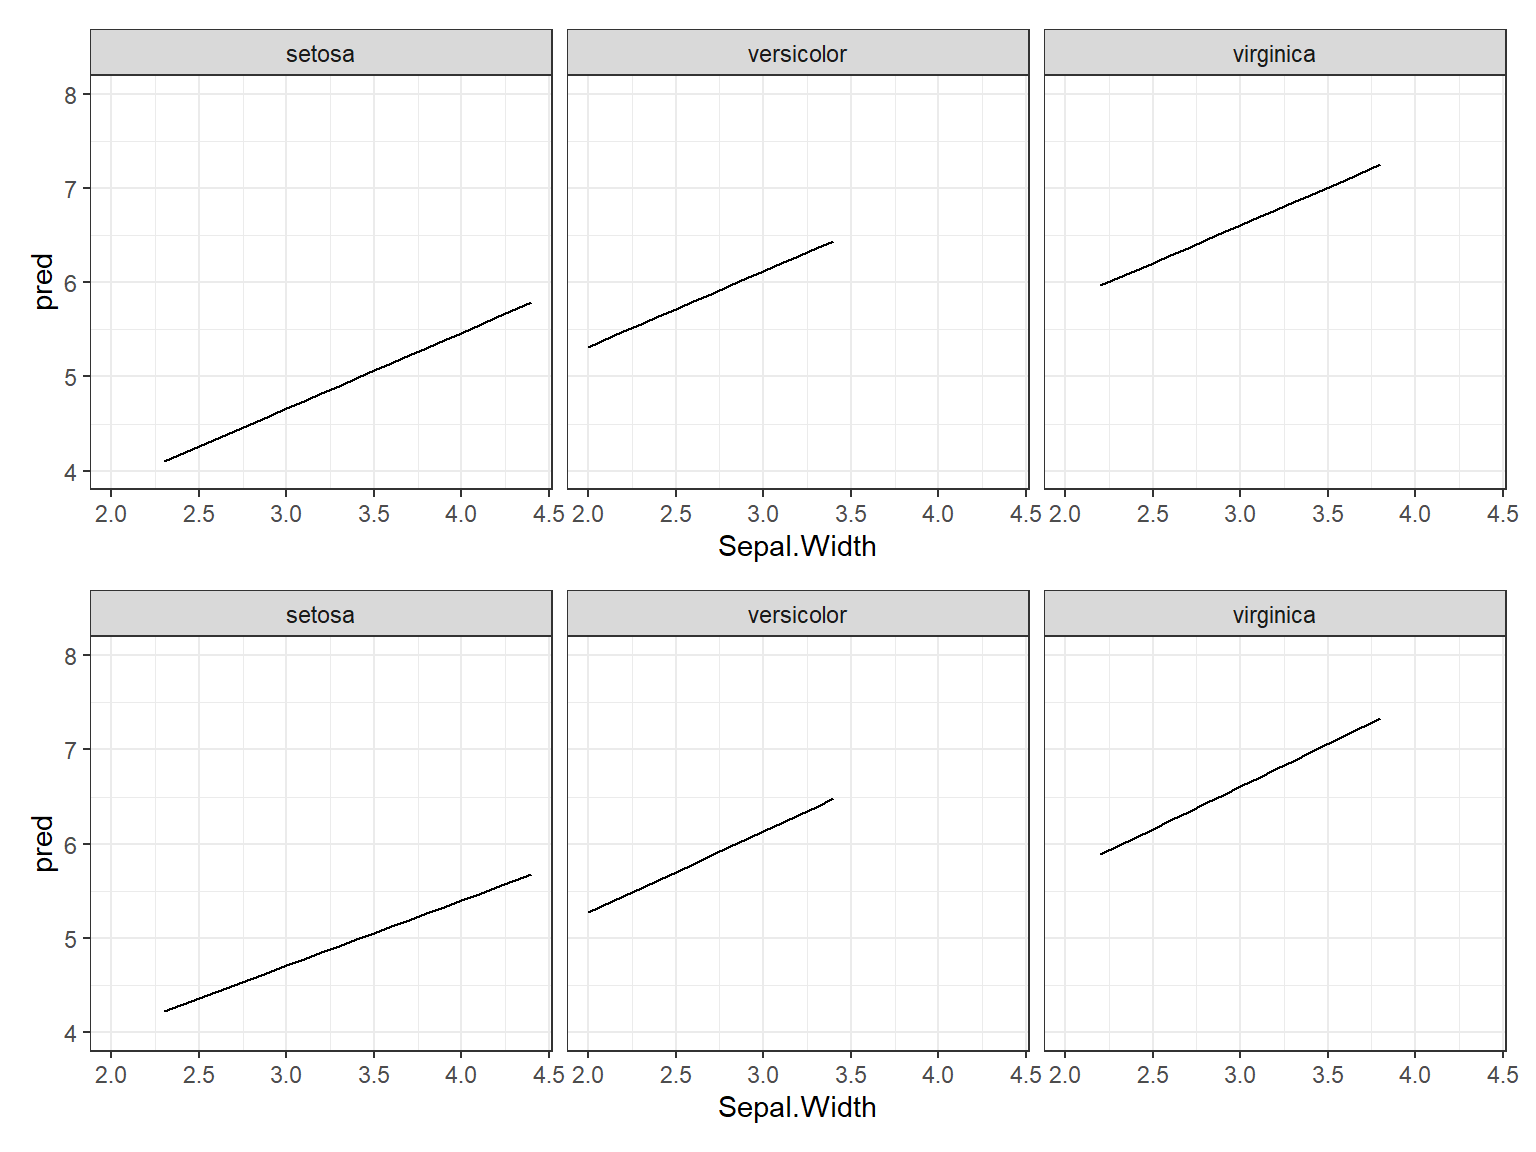
library(patchwork)library(ggplot2)library(dplyr)## no interaction between width and species assumptionlm1 <-lm(Sepal.Length ~ Sepal.Width + Species, data=iris)p1 <- iris |>mutate(pred =predict(lm1)) |>ggplot(aes(x = Sepal.Width, y = pred))+geom_line()+facet_wrap(~Species)+theme_bw()+scale_y_continuous(limits =c(4,8))## interaction between width and species assumptionlm2 <-lm(Sepal.Length ~ Sepal.Width*Species, data=iris)p2 <- iris |>mutate(pred =predict(lm2)) |>ggplot(aes(x = Sepal.Width, y = pred))+geom_line()+facet_wrap(~Species)+theme_bw()+scale_y_continuous(limits =c(4,8))p1/ p2
The upper figure show the outcome of the linear regression assumes no interaction between width and species. The bottom figure show the outcome of the linear regression assumes interaction between width and species.
NoteConclusion
As we can see, the slope for versicolor in the bottom figure clearly shows a difference between species, whereas the slopes for the three species in the top figure are the same.